What different logs are available for the azure resources?
Logs for Azure resources are available from different levels form the hierarchy set-up within azure. You can find an overview here.
Logs on the Azure subscription level:
- Service health – The Service Health portal provides you with a customizable dashboard which tracks the health of your Azure services in the regions where you use them. In this dashboard, you can track active events like ongoing service issues, upcoming planned maintenance, or relevant health advisories.
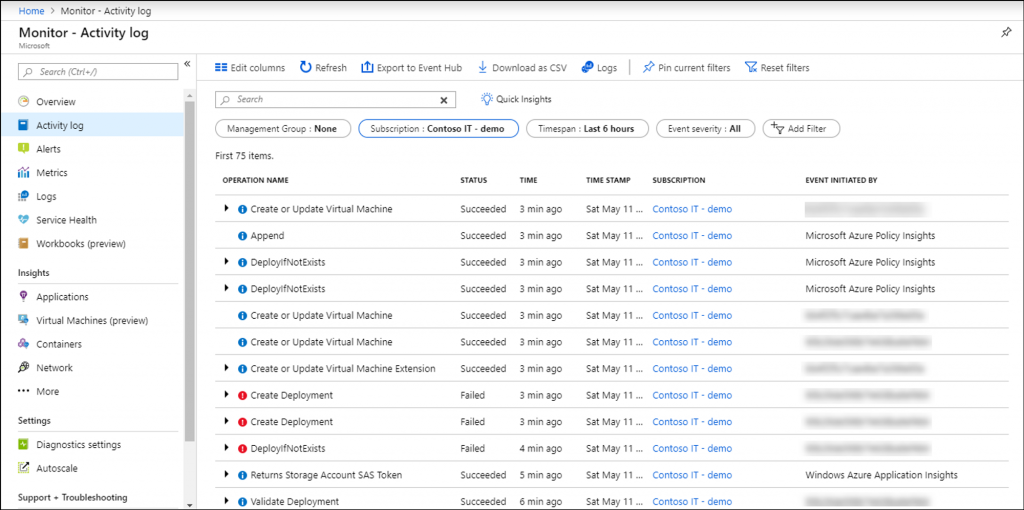
- Activity log – The Azure Monitor activity log is a platform log in Azure that provides insight into subscription-level events. Use the Activity log to determine the what, who, and when for any write operations (PUT, POST, DELETE) taken on the resources in your subscription.
- Activity log events are retained in Azure for 90 days and then deleted.
- You can access the activity log from most menus in the Azure portal. The menu that you open it from determines its initial filter. If you open it from the ‘Monitor’ menu, the only filter is on the subscription. If you open it from a resource’s menu, the filter is set to that resource. You can always change the filter to view all other entries. Select ‘Add Filter’ to add more properties to the filter.

Logs on Azure resources:
- Metrics – numeric data from monitored resources collected into a time-series database. Metrics are numerical values that are collected at regular intervals and describe some aspect of a system at a particular time. More information is provided here.
- Resource logs – provide insight into operations that were performed within an Azure resource (the data plane). Examples might be getting a secret from a key vault or making a request to a database. The content of resource logs varies by the Azure service and resource type. More information is provided here.
Logs storage options:
These logs can be saved in either a Storage account and / or a Log Analytics instance. The storage Account is generally the cheaper option. A Log analytics instance is useful when you want to query more extensively.
Further, if you would like to have more in-depth possibilities for analysis, an additional resource, Application Insights, can be set up for Virtual machines, Containers and AKS instances. Please keep in mind that we do not manage this resource as such – we can provide you with the instance and you could configure it according to your needs.
Application insights provides the following metrics:
- Live Metrics: Observe activity from your deployed application in real time with no effect on the host environment.
- Availability: Also known as synthetic transaction monitoring. Probe the external endpoints of your applications to test the overall availability and responsiveness over time.
- GitHub or Azure DevOps integration: Create GitHub or Azure DevOps work items in the context of Application Insights data.
- Usage: Understand which features are popular with users and how users interact and use your application.
- Smart detection: Detect failures and anomalies automatically through proactive telemetry analysis.
